

Sean Tascatan, CFA
Chief Investment & Growth Officer
Nest Wealth Asset Management Inc.
Tascatan joins Nest Wealth with over 15 years of investment management experience, including serving as lead portfolio manager on award-winning funds and helping manage multi-billion-dollar portfolios. He previously held senior roles at Starlight Capital, Sentry Investments and BMO Private Wealth. At Nest Wealth, he is leading investment strategy and asset allocation.
Earnings carried the quarter. Bonds paid the price.
On the surface, the third quarter looked calm. The S&P 500 returned 2.3% in U.S. dollars and the S&P/TSX Composite added 1.6%. Underneath those numbers, it was a busy quarter. Brent crude pushed back above US$100 a barrel as the conflict between the U.S. and Iran flared up again, the Federal Reserve raised rates for the first time since 2023, and the U.S. 10-year Treasury yield ended September at 5.29%. Bonds took most of the damage, while strong corporate earnings kept stock markets moving forward.
Three themes stood out to us:
- Profits carried the market. Earnings growth remained exceptionally strong, and in the U.S. profits grew faster than share prices, so valuations actually came down.
- Central banks changed direction. Most developed market central banks lifted rates during the quarter1.
- Bonds had a hard quarter but now pay more. The FTSE Canada Universe Bond Index fell 2.96%, and the higher yields behind that loss improve what bonds can earn from here.

Equities: Profits Did the Heavy Lifting
United States
U.S. stocks delivered a 2.3% total return in U.S. dollars, or 2.66% for Canadian investors once currency is included. The sector story was more interesting than the index. Energy jumped 17.2% on higher oil prices, followed by Information Technology at 7.2% and Health Care at 6.5%. Rate sensitive areas struggled, with Utilities down 12.4% and Industrials down 9.7%. Leadership was narrow enough that the average U.S. large cap stock actually fell 1.9% during the quarter2.
What kept the index moving forward was earnings. As the quarter closed, analysts expected third quarter S&P 500 earnings to come in about 29% higher than a year earlier, and the index finished September at roughly 19 times expected earnings for the next 12 months, slightly below its five and ten year averages3. In other words, profits have been rising faster than prices. To us, that is an important takeaway of the quarter. The market rose on earnings rather than on enthusiasm, which is a sturdier footing than the headlines suggest.
Canada
The S&P/TSX Composite rose 1.6%, its ninth quarterly gain in a row, yet just three of its 11 sectors ended the quarter higher4. Information Technology led with a 17.9% gain, with Shopify the main contributor. Materials rose 12.9% on strength in gold miners, and Energy added a more modest 3.3%. Higher oil prices supported Canadian producers in Q3, although a wider discount on Canadian heavy crude relative to WTI tempered the benefit for heavy-oil producers. Communication Services, Real Estate and Utilities each fell more than 7% as bond yields climbed. When most sectors fall and the index still rises, it is a good reminder of why we spread equity exposure across several regions instead of leaning on any one market.
International
International developed markets returned 1.16% in Canadian dollars, as measured by the MSCI EAFE Index. Japan led developed markets, Europe lagged, and emerging markets slipped after semiconductor stocks sold off in July.
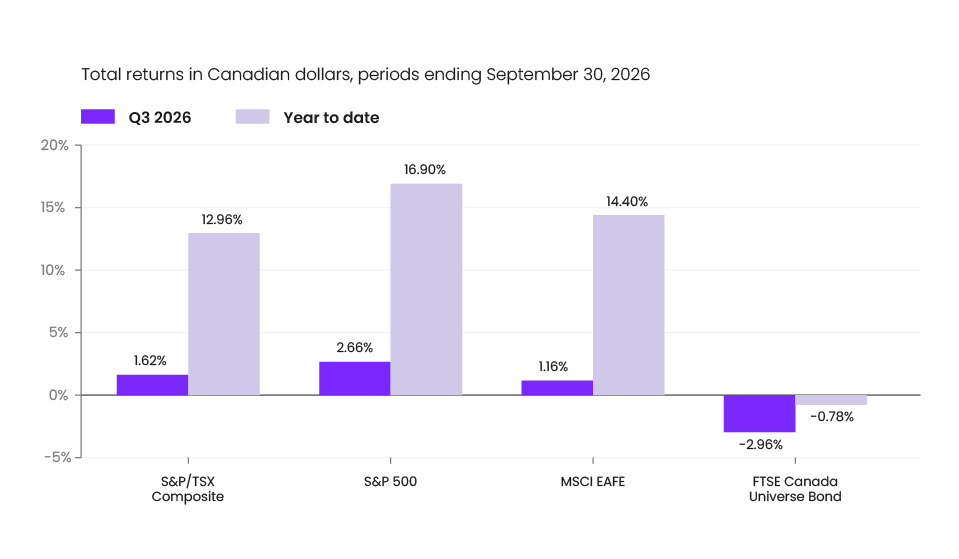
Figure 1. Equities posted modest gains in Q3 and remain well ahead year to date, while Canadian bonds slipped just below zero for the year.
Source: Nest Wealth Asset Management, using ATB Investment Management data (Bloomberg) as of September 30, 2026.
Central Banks: The Turn Toward Tightening
The biggest policy shift of the quarter came on September 16, when the Federal Reserve voted 12 to 0 for a quarter point increase, moving its benchmark rate to 3.75% to 4.00%. Fed officials now expect core PCE inflation, their preferred measure, to finish the year at 3.4%, and 16 of 18 participants see another increase before year end. Chair Kevin Warsh was blunt, telling reporters that inflation has been “too high … for too long5.
The Fed was not alone. The European Central Bank raised rates by 25 basis points in September, and the Bank of Japan lifted its policy rate to 1.25% in a 7 to 2 vote, its highest level in 31 years6.
Much of the recent rise in inflation has come from energy. U.S. inflation was easing before the Iran conflict began, but energy prices have climbed since February and pushed headline measures higher. Excluding energy, U.S. consumer prices were 2.5% higher than a year earlier, the lowest annual rate since the pandemic7. This matters for the rate outlook. Price increases caused by energy tend to fade once oil prices settle, which could limit how far central banks need to raise rates. The main risk is that higher fuel costs spread into wages and services, where inflation usually lasts longer.
Fixed Income: A Tough Quarter With a Silver Lining
Bonds had their toughest stretch in some time. The FTSE Canada Universe Bond Index fell 2.96% in the quarter, leaving it down 0.78% for the year. In the U.S., the Bloomberg U.S. Aggregate Index fell 3.5%, its weakest quarter since 20228.
A broad index of Canadian investment grade bonds had its worst quarter since the third quarter of 2023, and how much an investor lost depended heavily on maturity. Bonds maturing in more than 10 years lost 6.4%, while those maturing in 1 to 5 years lost just 0.9%9. Over the quarter, the 10-year Government of Canada yield rose from 3.38% to 3.99%, while the U.S. 10-year Treasury yield climbed from 4.44% to 5.29% (Figure 2).
Several forces pushed yields higher at the same time: rising oil prices, tighter central bank policy, U.S. government debt that has now passed $40 trillion, and a wave of borrowing by the largest technology companies to pay for their AI buildout. The yield on 30-year U.S. inflation protected Treasuries reached 3.28%, its highest level since the Treasury began issuing them on a regular schedule in 200410. Investors are demanding a real return to lend for the long haul, which tells us this selloff has as much to do with government borrowing as it does with inflation.
Canadian yields stayed well below U.S. levels, a reflection of a cooler economy at home. Canada lost 42,000 jobs in August, even as inflation stood at 3.0%11.
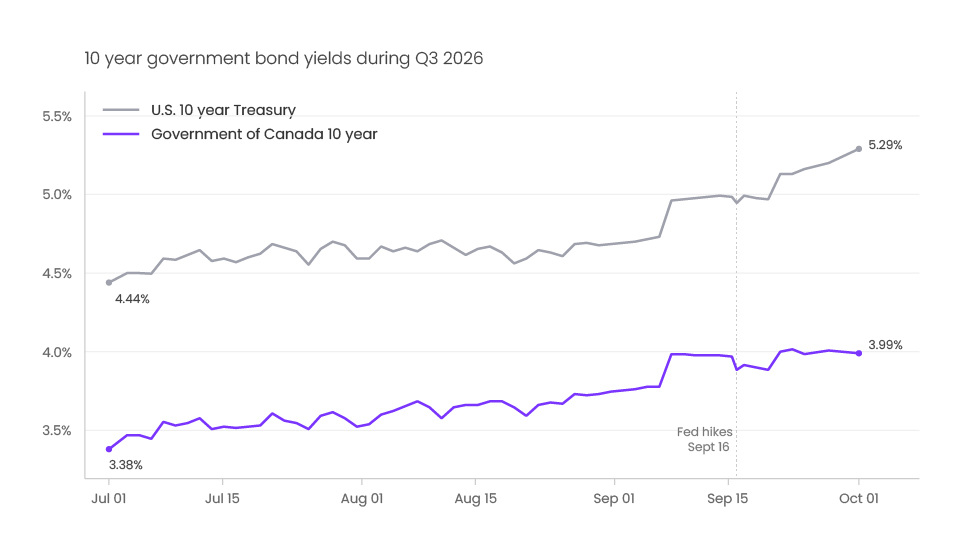
Figure 2. Yields rose steadily in both countries, with U.S. yields moving further and faster.
Sources: Nest Wealth Asset Management, using daily data from the Bank of Canada (Government of Canada 10 year benchmark bond yield) and the Federal Reserve Bank of St. Louis (FRED, series DGS10), June 30 to September 30, 2026. The Canadian series ends September 29, 2026, the last date in the quarter with a published value.
No one enjoys a negative quarter from the part of the portfolio meant to provide stability. But the same rise in yields that hurt prices has also raised the income bonds will generate from here, and a higher starting yield has historically been one of the better guides to what a bond portfolio can earn over time. We would not build a portfolio around any single forecast, but today’s yields could give bonds a better chance of doing their job than they had a few years ago.
How Our Portfolios Performed
All three of our illustrative ETF model portfolios were positive for the year through September 30, 2026. Growth returned 8.77%, Balanced returned 6.02% and Conservative returned 2.58%.
The gap between the three comes down almost entirely to asset mix. Growth holds about 81% in equities and benefited most from this year’s stock market gains. Conservative holds about 69% in fixed income, so it felt more of the pressure on bonds. Even so, Conservative stayed positive for the year while the broad Canadian bond market was slightly negative, with its equity sleeve doing much of the work.
That is diversification working the way it should. It does not mean every holding rises together. It means the pieces of a portfolio could react differently to the same event, so no single event decides the outcome. We would caution against reading too much into one quarter or even one year. The right portfolio is the one that fits your goals, your time horizon and your comfort with risk.
What We Are Watching in Q4
- Energy and inflation. Oil remains the swing factor. U.S. diesel prices reached record highs above US$6 a gallon in September,12 and because diesel moves freight, food and goods, it can pass into everyday prices faster than crude itself. If energy costs spread into wages and services, central banks may need to do more.
- The Fed in December. Fed officials’ own projections point to one more quarter point increase before year end. The Fed may look to stop around that level unless energy costs start feeding into wages and services. A long hiking cycle is not our base case.
- A possible Bank of Canada hike. The Bank held at 2.25% through the quarter, but it’s warning that inflation risks had risen puts a rate increase on the table for its next decision, scheduled for October 28. A softer job market and ongoing trade friction argue for patience. If the Bank does raise rates, we expect any moves to be gradual.
- Earnings breadth and AI. AI investment remains an important driver of earnings growth, with the clearest benefits concentrated among semiconductor and other infrastructure suppliers. We want to see earnings strength broaden beyond a handful of sectors.
- The U.S. midterm elections. The November vote will shape U.S. policy on trade, spending and energy for the next two years. Elections can unsettle markets in the short term, but once the result is known, investors usually have a clearer view of the outlook for growth, inflation and interest rates.
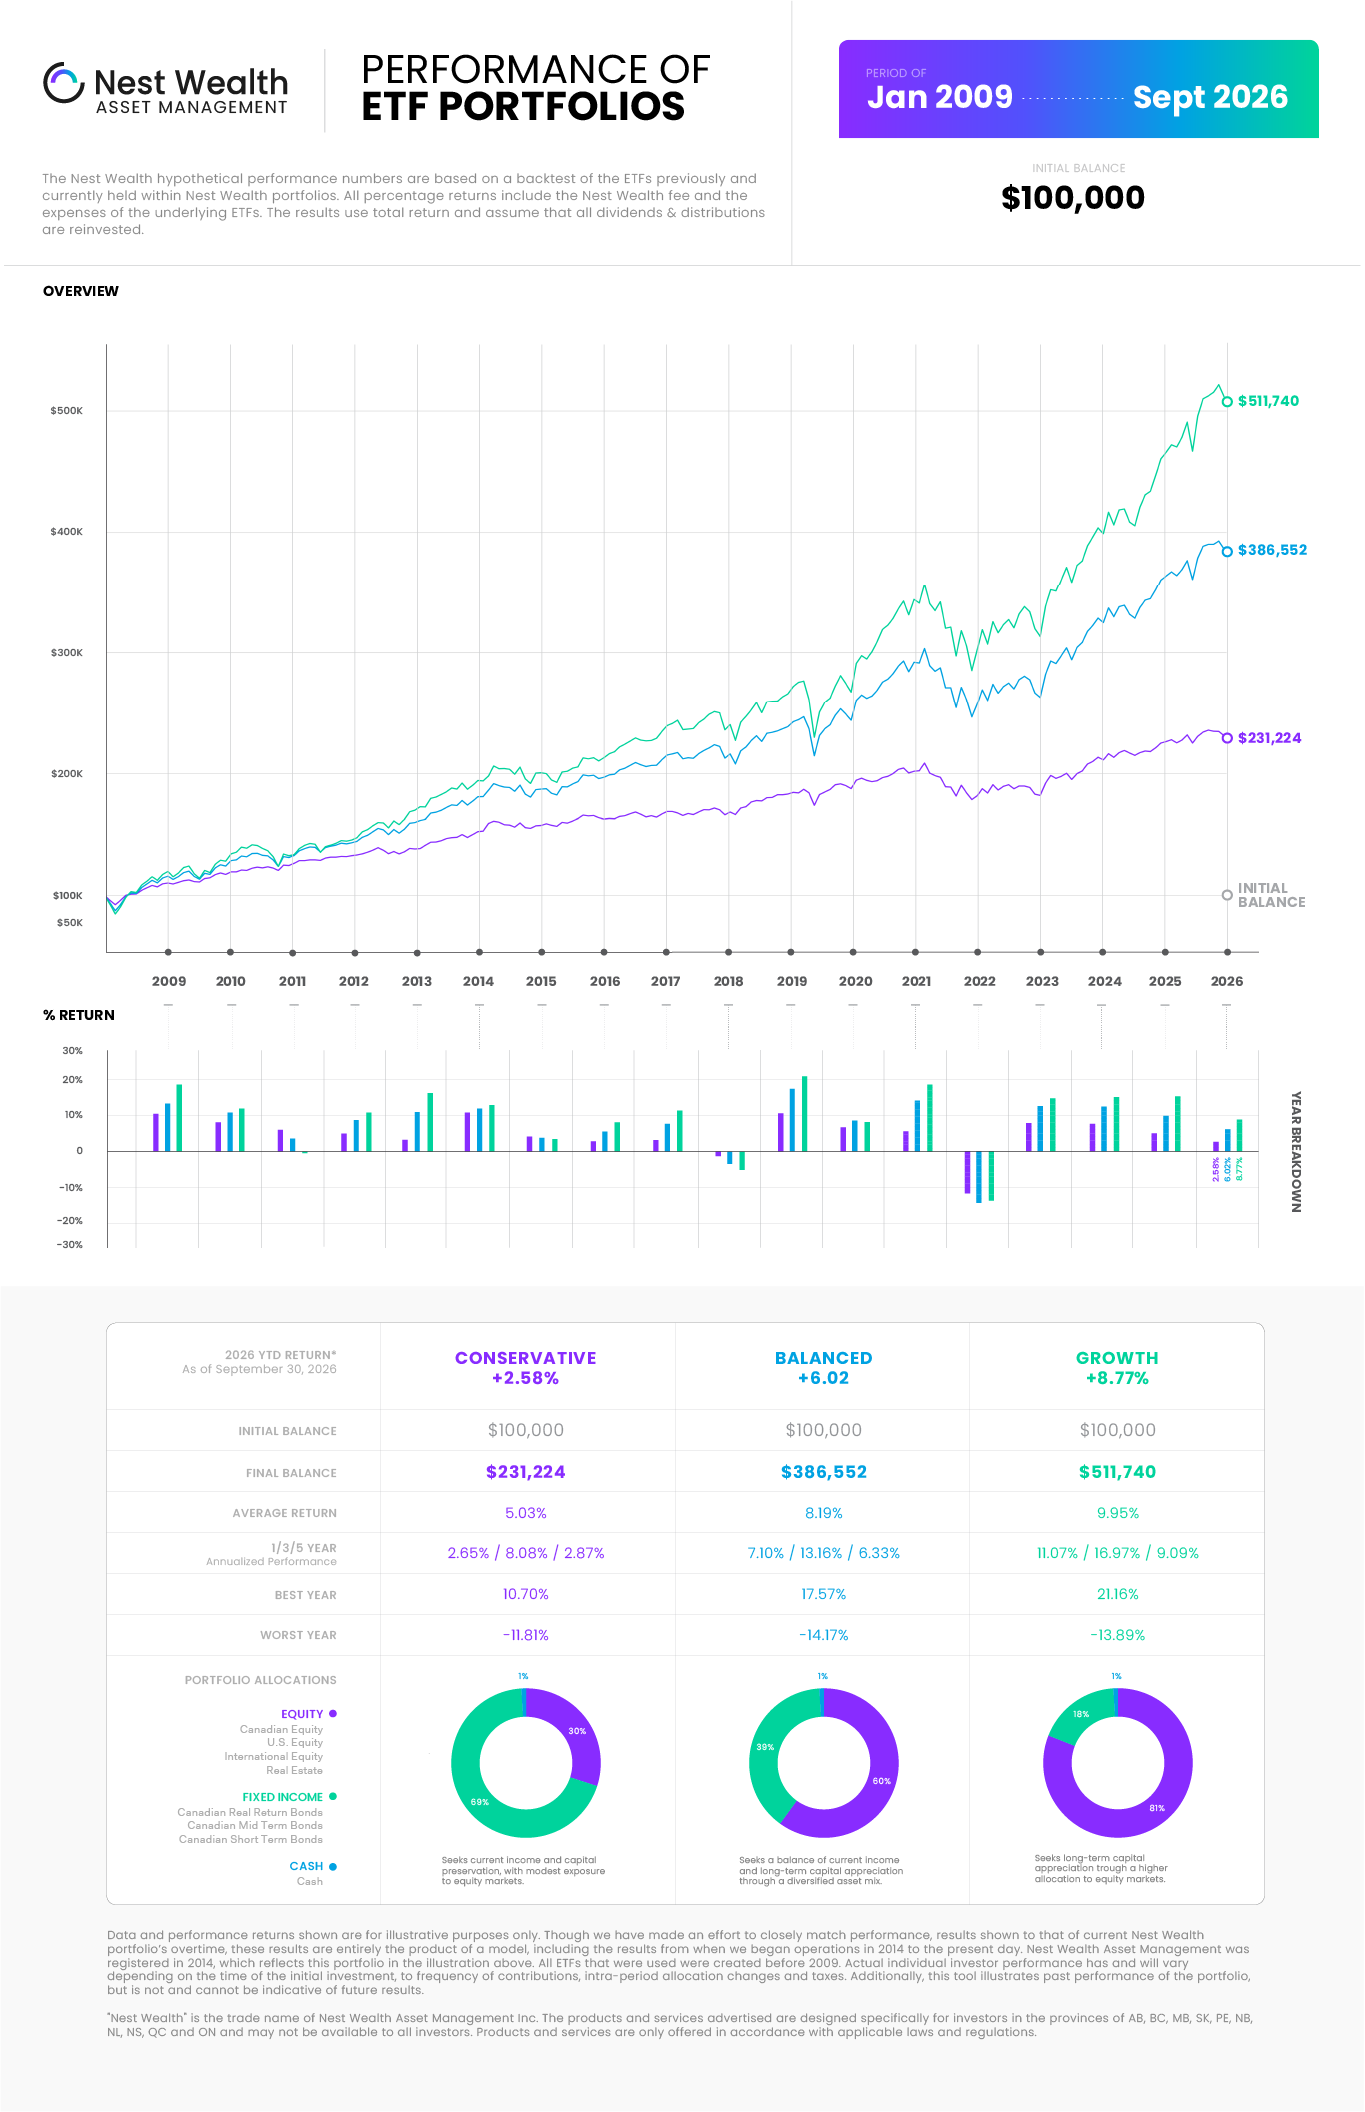
Returns shown are for Nest Wealth’s illustrative ETF model portfolios as of September 30, 2026.
Data and performance returns shown are for illustrative purposes only. Though we have made an effort to closely match performance, results shown to that of current Nest Wealth portfolio’s overtime, these results are entirely the product of a model, including the results from when we began operations in 2014 to the present day. Nest Wealth Asset Management was registered in 2014, which reflects this portfolio in the illustration above. All ETFs that were used were created before 2009. Actual individual investor performance has and will vary depending on the time of the initial investment, to frequency of contributions, intra-period allocation changes and taxes. Additionally, this tool illustrates past performance of the portfolio but is not and cannot be indicative of future results.
Model returns do not reflect the actual experience of any individual client account, and individual results will vary based on timing of contributions and withdrawals, rebalancing, taxes and fees. Index returns are provided for illustration only; indexes are unmanaged and cannot be invested in directly. Past performance is not indicative of future results.
This commentary is provided for information purposes only and does not constitute personalized investment, tax or legal advice, or an offer or solicitation to buy or sell any security. Opinions and forecasts reflect our views as of the date of publication and may change without notice. Third party data is believed to be reliable but is not guaranteed.
“Nest Wealth” is the trade name of Nest Wealth Asset Management Inc. The products and services advertised are designed specifically for investors in the provinces of AB, BC, MB, SK, PE, NB, NL, NS, QC and ON and may not be available to all investors. Products and services are only offered in accordance with applicable laws and regulations.
Source:
1. J.P. Morgan Asset Management, Review of markets over the third quarter of 2026, October 1, 2026. https://am.jpmorgan.com/gb/en/asset-management/per/insights/market-insights/market-updates/monthly-market-review/
2. Glenmede, The Quarterly Recap Q3 2026: Economic & Market Recap, October 1, 2026. https://www.glenmedeim.com/news-and-insights/the-quarterly-recap-q3-2026-economic-market-recap/
3. FactSet, S&P 500 Earnings Season Update, October 23, 2026. Blended third quarter earnings growth rate and forward 12 month P/E ratio as at September 30, 2026. https://insight.factset.com/sp-500-earnings-season-update-october-23-2026
4. ClearBridge Investments, Canadian Equity Strategy Commentary, Third Quarter 2026. S&P/TSX Composite sector returns cited in this section. https://www.clearbridge.com/perspectives/commentaries/canadian-equity-strategy
5. CNBC, Fed approves interest rate hike, signals one more to come this year, September 16, 2026. https://www.cnbc.com/2026/09/16/fed-rate-decision-september-2026.html
6. Bank of Japan, Change in the Guideline for Money Market Operations, September 18, 2026. https://www.boj.or.jp/en/mopo/mpmdeci/mpr_2026/k260918a.pdf.
Reuters, Brokerages expect next BOJ rate hike in December, October 16, 2026 (31 year comparison). https://www.reuters.com/world/asia-pacific/brokerages-expect-next-boj-rate-hike-dec-further-tightening-2027-2026-10-16/
7. Citizens Business Bank, Market Perspective, Third Quarter 2026. https://www.cbbank.com/news-media/market-perspective-third-quarter-2026/
8. Union Bank & Trust, Investment Overview: 3rd Quarter 2026, October 8, 2026. https://www.ubt.com/learning-center/blogs/investment-overview-3rd-quarter-2026
9. Morningstar Canada, How Bond Funds Performed in Q3 2026, October 6, 2026. Morningstar Canada Core Bond Index and its 10+ Year and 1 to 5 Year sub-indexes. https://global.morningstar.com/en-ca/bonds/how-bond-funds-performed-q3-2026
10. ATB Investment Management, Q3 2026 IPM Economic & Market Summary, October 9, 2026. U.S. federal debt, corporate bond issuance and 30 year TIPS yield. https://atbim.atb.com/institutions/q3-2026-ipm-economic-and-market-summary/
11. Morningstar Canada, Why Some See Relief from the Bond Selloff in Q4, October 7, 2026. Canadian employment and inflation data for August 2026. https://global.morningstar.com/en-ca/markets/why-some-see-relief-bond-selloff-q4